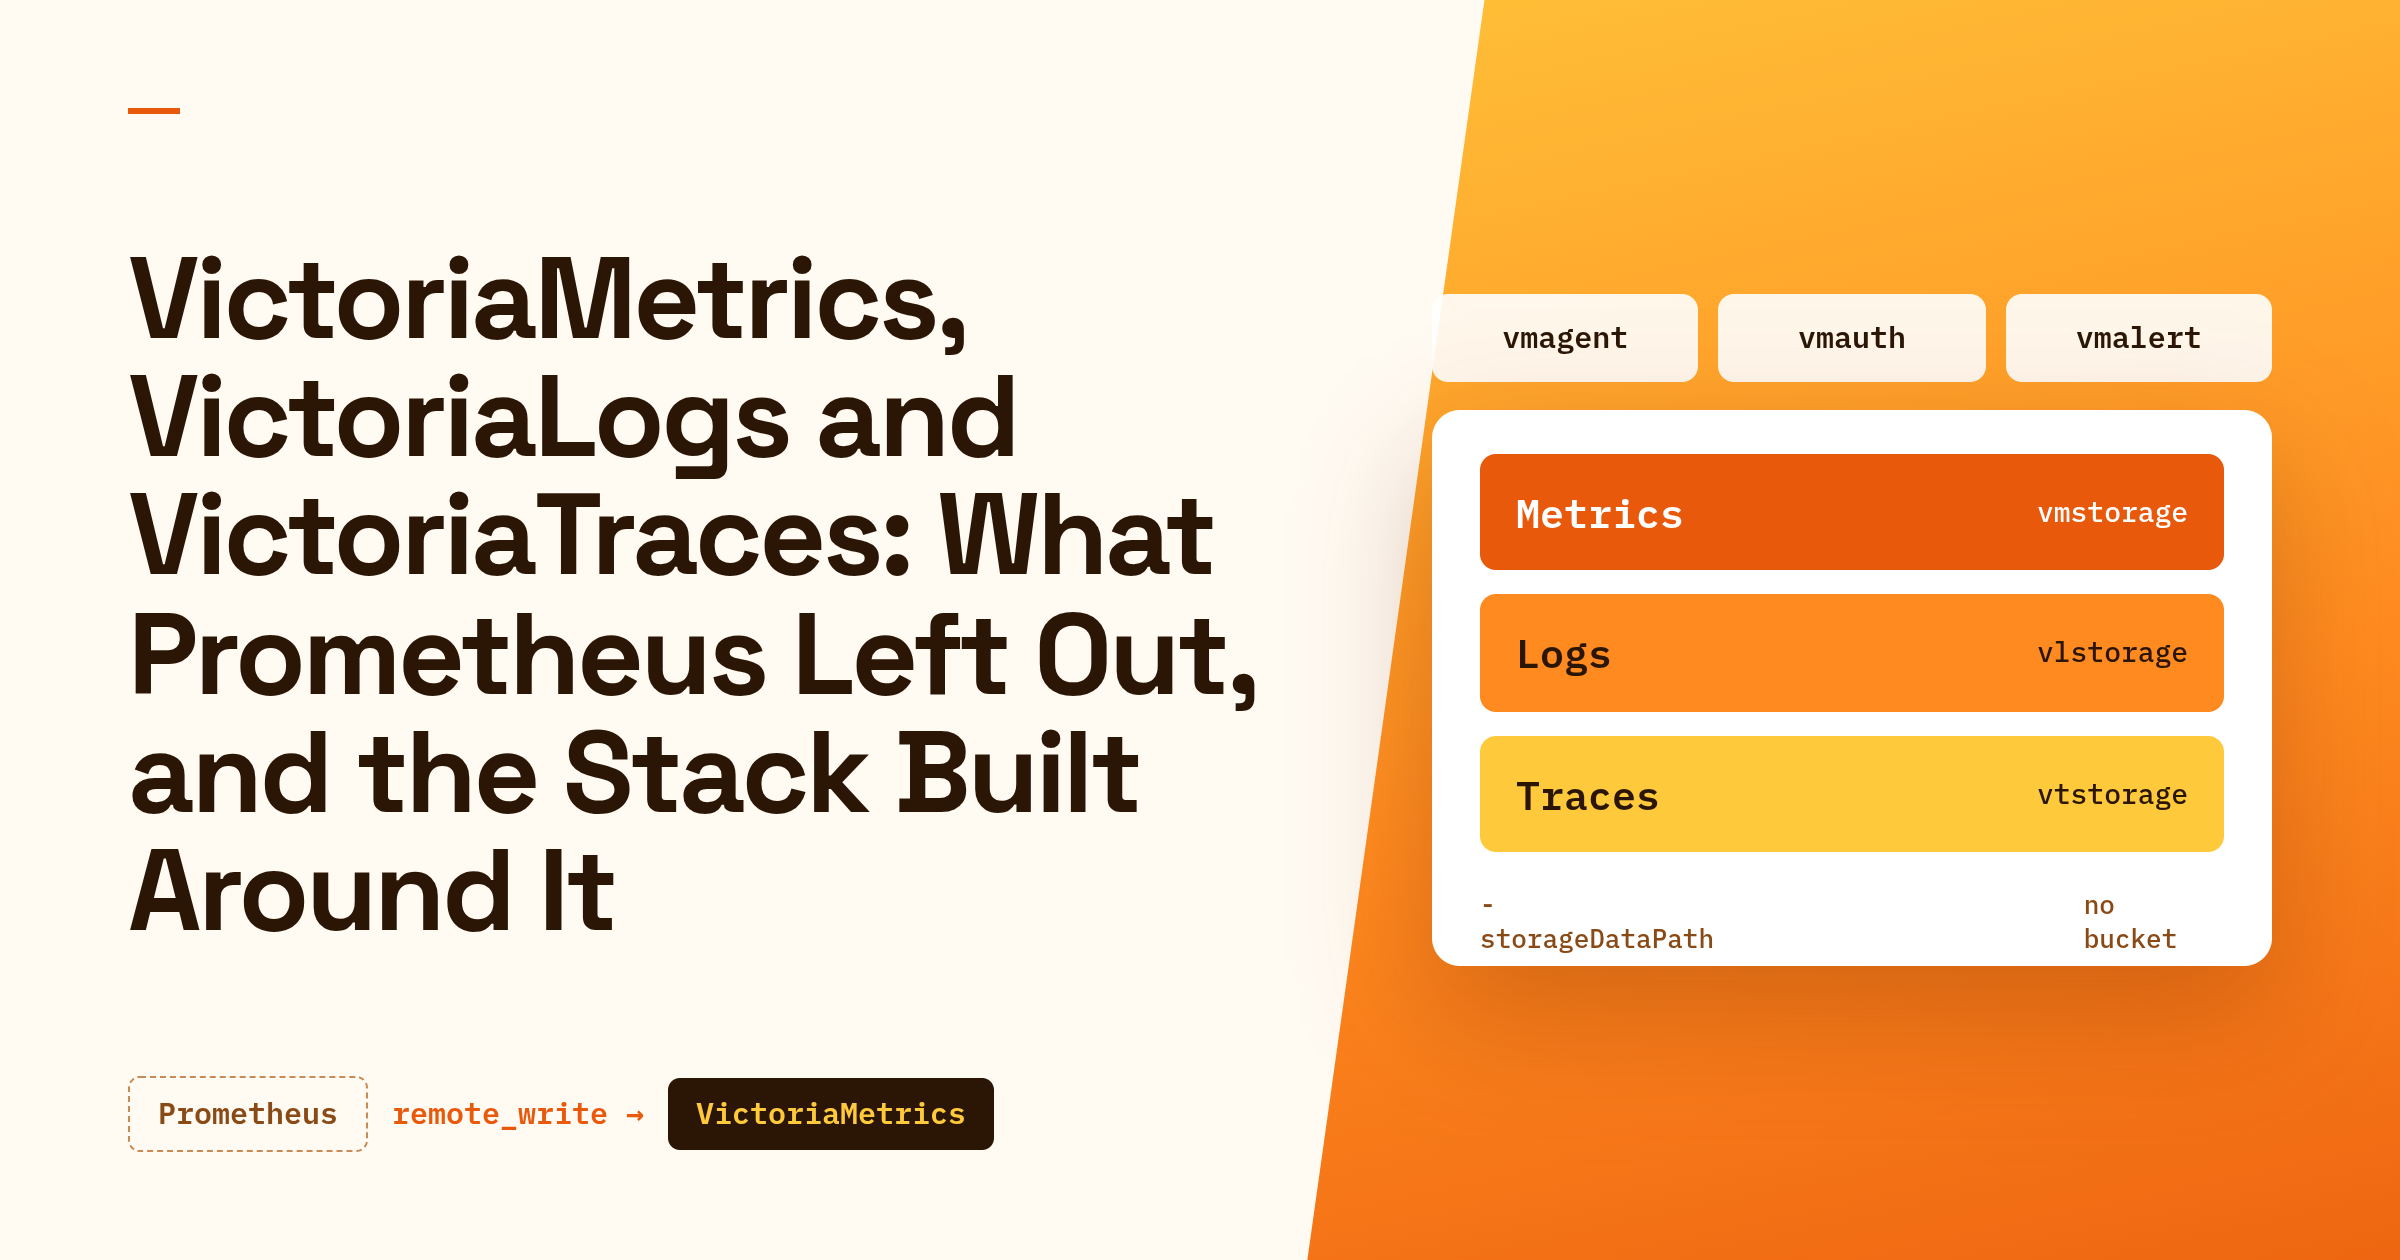
The Prometheus storage docs have two sentences that explain a whole category of software:
Prometheus’s local storage is limited to a single node’s scalability and durability. Instead of trying to solve clustered storage in Prometheus itself, Prometheus offers a set of interfaces that allow integrating with remote storage systems.
The limit is deliberate. Prometheus keeps what fits on one machine and leaves the rest to whoever wants to build it. Thanos, Cortex and Mimir were built on the other side of that interface. So was VictoriaMetrics, which began as a storage backend you point remote_write at and has since grown into a full stack: a metrics database, a scraping agent, a rule evaluator, an auth proxy, a log database and, since last year, a trace database.
VictoriaMetrics is best understood by looking at what Prometheus deliberately does not do. This is an introduction for someone who runs Prometheus on Kubernetes, probably with Loki beside it, has heard the name VictoriaMetrics, and could not say what vminsert does.
I am writing from the Prometheus and Loki side, which is what my other posts are about. What follows comes from my reading of the Victoria projects’ docs, repositories and tutorials online. I have been a long term user of kube-prometheus stack and I am really liking what Victoria stack has to offer.
What Prometheus leaves out, on purpose
A Prometheus server is one binary with four jobs: it scrapes targets, stores the samples in a local TSDB, evaluates recording and alerting rules, and answers PromQL queries. For one cluster that is a good design. There is one thing to deploy, and it depends on nothing else being up.
The limits come from the same design.
One node, one local disk. There is no clustering. When a server runs out of room, the built-in answer is more servers with the scrape targets divided between them. The Prometheus Operator exposes this as shards, and every shard is a separate Prometheus with its own data.
No global view of the detail. Each server answers queries about its own data. Federation lets one server scrape selected series from another, and the docs’ example is a set of global servers that “collect and store only aggregated data” from the local ones. That is a global view of the aggregates you picked in advance. It is not a query layer over many servers, so a question nobody planned for, such as which pods in forty clusters were throttled last night, has nowhere to run.
Retention bounded by the disk. The default retention is 15 days. You can raise it with --storage.tsdb.retention.time, and then a year of history lives on one volume behind one pod, in a store the docs call “not arbitrarily scalable or durable in the face of drive or node outages”.
Memory that follows cardinality. The newest samples of every active series are held in memory before they are cut into blocks on disk. Pod churn and labels with many values multiply the series count, and RAM goes up with it.
Prometheus’s answer to the middle two is remote_write: stream every sample to another system, and let that system keep the history and answer the queries that span servers. It does nothing for the first or the fourth. The scraping server is still one node holding every active series in memory, and the remote write tuning page says shipping them adds to the bill: “Most users report ~25% increased memory usage”.
Three well-known projects were built to be that other system, and each is a distributed system of some size. Thanos gets the data out of Prometheus two ways, a Sidecar that uploads the TSDB blocks to a bucket or a Receiver that takes remote_write, and its tutorial lists seven components (Sidecar, Store Gateway, Compactor, Receiver, Ruler, Querier, Query Frontend) around that bucket. Cortex has distributors, ingesters, queriers, a compactor and a store gateway, with object storage, a key-value store for its hash ring and optional caches behind them. Mimir, Grafana’s fork of Cortex, lists seven required components, needs an object store too, and since version 3.0 prefers an architecture with Kafka in the middle.
That complexity buys something real: long-term data in a bucket that never needs resizing. It is also a lot to operate if what you wanted was Prometheus with a longer memory.
“But we run Prometheus in a cluster”
That was my first objection to “there is no clustering”, and it comes from two different things sharing the word cluster.
Running Prometheus on a Kubernetes cluster means its pod can be scheduled on any node and rescheduled when a node dies. It does not make Prometheus a clustered database. Set replicas: 2 on a Prometheus Operator resource and you get what the Prometheus FAQ recommends for high availability: “run identical Prometheus servers on two or more separate machines.” The operator’s HA docs describe the pair as instances with the same configuration, apart from one external label that tells them apart (prometheus_replica by default), which “scrape the same targets and evaluate the same rules”.
               targets
              /       \
    Prometheus A     Prometheus B
         |                |
      TSDB A           TSDB B
Isn’t that what PostgreSQL and Redis replicas are?
It looks the same from a distance: a few pods, one of which can die. The difference is what flows between them.
    writes
      |
      v
   primary  ==== WAL stream ====>  standby
A PostgreSQL standby does not take the application’s writes and build its own state. In the docs’ words, “In standby mode, the server continuously applies WAL received from the primary server.” There is one database state, produced by the primary, and the standby is a copy of it. A standby that restarts or falls behind carries on from the last WAL record it has, and replication slots exist so that the primary “does not remove WAL segments until they have been received by all standbys”. Redis has the same shape: the master keeps a replica updated by sending it “a stream of commands”, and a replica that loses the link reconnects and tries to “obtain the part of the stream of commands it missed during the disconnection”.
Replication, then, means one node decides what the data is and the others receive it, including whatever they missed. An HA Prometheus pair has no stream. A and B each scrape, each write their own samples to their own TSDB, and neither knows the other exists. That is duplication. The Alertmanager deduplicates the identical alerts the pair sends, which is why paging still works. Nothing reconciles the data.
How two replicas drift
Both replicas scrape a target every 15 seconds. At 12:05, A crashes and stays down for five minutes.
A's TSDB:   12:00 ======= 12:05   [ gap ]   12:10 =======>
B's TSDB:   12:00 =======================================>
When A comes back, B does not send it the missing five minutes, because no mechanism exists that could. A carries a hole in every series until that data ages out of retention. Put both replicas behind one Service as a Grafana datasource, and the same panel has a gap or not depending on which pod answered.
The two differ even when nothing crashes. Each replica scrapes on its own schedule, and the operator docs warn that queries against each “may return slightly different results”, recommending sticky sessions for dashboards.
So something above the pair has to choose one copy or merge the two. Thanos does it at query time: its Querier is told which label marks a replica (--query.replica-label) and deduplicates across it. Cortex does it on the way in, with an HA tracker that “deduplicates incoming samples from redundant Prometheus servers”.
Why VictoriaMetrics was built, and what is underneath it
VictoriaMetrics was written by Aliaksandr Valialkin, the author of the Go HTTP library fasthttp and now co-founder and CTO of the company that carries the project’s name. Its GitHub repository dates from September 2018, and the source was released under the Apache 2.0 licence on 22 May 2019.
It started as the thing Prometheus’s docs invite: a remote storage. Valialkin’s own write-up of the origin says his team already ran ClickHouse for large event streams and first tried ClickHouse itself as the remote storage for Prometheus, before writing a database for that one job.
The aim was a remote storage without the moving parts. The single-node version is one binary configured with command-line flags, and it keeps everything under one directory, -storageDataPath. It needs no object store, no key-value store for a hash ring and no cache tier. When one node is not enough, a cluster version splits the same engine into three services: vminsert, vmselect and vmstorage.
A MergeTree-like storage engine
The ClickHouse influence shows in the storage engine, which the docs describe as “MergeTree-like”, after ClickHouse’s table engine. The company’s posts on vmstorage ingestion and merging fill in the details:
- Every unique combination of metric name and sorted labels is assigned an internal ID, the TSID.
- Incoming samples are buffered in memory and then written out as parts. The docs warn that samples still in the buffer are not available to queries “for up to a few seconds”.
- Small parts are merged into bigger ones in the background, the way an LSM tree compacts.
- Parts are grouped into partitions, and a partition covers one calendar month.
Inside a part, blocks are sorted by TSID, and timestamps and values go to separate files, each with its own compression.
What that buys, according to the project’s docs, is a database that uses “up to 7x less RAM than Prometheus, Thanos or Cortex when dealing with millions of unique time series”.
The pieces: Prometheus’s jobs, one component each
Prometheus bundles its four jobs into one process. VictoriaMetrics gives each to a separate component, and you run the ones you need.
| Job | Prometheus | VictoriaMetrics |
|---|---|---|
| Scrape and collect | Built in | vmagent: scrapes, relabels, buffers to disk when the storage is unreachable, replicates or shards across several storages |
| Store and query | Built-in TSDB | Single-node victoria-metrics, or the cluster: vminsert, vmselect, vmstorage |
| Rules and alerts | Built in | vmalert, which sends alerts to an ordinary Alertmanager |
| Auth, routing, tenants | No tenants | vmauth, an HTTP proxy that authorises, routes and load balances |
| Query language | PromQL | MetricsQL, “backwards-compatible with PromQL” |
| UI | Built-in web UI | vmui, plus Grafana as usual |
| Backups and migration | TSDB snapshots | vmbackup and vmrestore, vmctl |
vmagent’s docs present it as a drop-in replacement for Prometheus as a scraper, and it forwards everything it collects over remote_write. If the storage is down it spools to -remoteWrite.tmpDataPath and catches up afterwards. The docs say it “uses much lower amounts of RAM, CPU, disk IO, and network bandwidth than Prometheus”, which is at least plausible for a process that stores nothing and answers no queries. Prometheus has its own version of that: agent mode (--agent) drops the TSDB, alerting and rule evaluation and only scrapes and forwards. The quoted sentence does not say which Prometheus it means, and I read it as the full server.
In the cluster, vminsert and vmselect are stateless and vmstorage holds the data. The docs call it a shared-nothing architecture. vminsert picks a storage node for each series by consistent hashing over the metric name and labels, and vmselect asks every storage node and merges what comes back.
vmalert runs Prometheus-format rules against a datasource URL, sends firing alerts to Alertmanager and writes recording-rule results back with remote write. It holds alert state in memory and can restore it after a restart from what it wrote.
MetricsQL comes with a small warning. The page that says backwards-compatible also lists deliberate differences: rate and increase do not extrapolate, and they take the last sample before the lookbehind window into account. Your dashboards should load, and some panels can show slightly different numbers than Prometheus did.
Push as well as pull
Prometheus pulls. VictoriaMetrics scrapes too, and it also accepts pushes in most formats you might already be emitting: Prometheus remote write, InfluxDB line protocol, Graphite, OpenTSDB, DataDog, OpenTelemetry, NewRelic, CSV and JSON lines. vmagent takes the same protocols and forwards them, so one agent can sit in front of a mixed estate.
Tenants in the URL
The cluster version is multi-tenant, and the tenant is part of the path:
write:  http://<vminsert>:8480/insert/<accountID>:<projectID>/prometheus/api/v1/write
read:   http://<vmselect>:8481/select/<accountID>:<projectID>/prometheus/
Each ID is an arbitrary 32-bit integer, projectID defaults to 0 when left out, and a tenant is created the first time something writes to it. If you know Loki’s X-Scope-OrgID, this is the same idea with numbers in the path where Loki has a string in a header.
The path on its own is routing, not access control. Access control comes from putting vmauth in front: it maps a username or token to a URL prefix with the tenant in it, so a client never chooses its own tenant.
users:
  - username: "cluster-a"
    password: "***"
    url_prefix: "http://vminsert:8480/insert/1/prometheus/"
  - username: "cluster-b"
    password: "***"
    url_prefix: "http://vminsert:8480/insert/2/prometheus/"
It is the same arrangement as deriving the Loki tenant from basic auth at the gateway.
The docs call tenants “isolated”, and that describes their data. The storage nodes are shared: “Data for all the tenants is evenly spread among available vmstorage nodes”, and performance and resource usage depend “mostly on the total number of active time series in all the tenants”. The docs’ point there is that tenants are free to add. Mine is that one tenant’s cardinality comes out of capacity everyone shares. A query normally addresses one tenant, and since v1.104.0 vmselect also has a multitenant endpoint that can query across them.
The HA pair, again
Back to the two replicas with a five-minute hole in one of them. Point both at the same VictoriaMetrics, whether they are two Prometheus servers using remote_write or two vmagents, and set -dedup.minScrapeInterval to the scrape interval: on the single-node binary, or on both vmselect and vmstorage in a cluster. VictoriaMetrics then “leaves a single raw sample with the biggest timestamp” for each series in each interval. While A is down, B’s samples are the only ones arriving, and the stored series has no hole.
The condition is that both replicas write the same series, which the docs spell out as identical external_labels. The Prometheus Operator’s prometheus_replica label breaks that by design, so it has to go: the operator leaves it off when replicaExternalLabelName is set to an empty string.
Keeping a year of metrics without a bucket
My question after reading the Prometheus limits was the obvious one. If retention on Prometheus is bounded by local disk, and VictoriaMetrics also writes to local disk, what changed? There is no single trick. It makes a disk hold more, makes dropping old data cheap, and lets you add nodes.
A disk holds more because of the compression in the storage engine. The docs put a number on it, “up to 7x less storage space is required compared to Prometheus, Thanos or Cortex”, and the link behind that number goes to a benchmark on node-exporter metrics written by Valialkin. What you get depends on your data, and I would measure my own series before sizing volumes from a README.
Retention is a flag. -retentionPeriod defaults to one month and takes values like 1y. Data is “split in per-month partitions”, and “data partitions outside the configured retention are deleted on the first day of the new month.” A month’s directory is removed whole, and only once the whole month is past retention, so a 1y setting can have close to thirteen months on disk.
When one disk is not enough, you add vmstorage nodes to the cluster. Existing data is not rebalanced onto a new node; the FAQ says so, and explains that automatic rebalancing was left out because of what it costs in CPU, network and disk IO. Replication is opt-in. -replicationFactor=N on vminsert writes each sample to N distinct storage nodes, with -dedup.minScrapeInterval=1ms on vmselect so the copies collapse at query time. The docs are lukewarm about their own feature: “It is more cost-effective to offload the replication to underlying replicated durable storage”, meaning replicated block volumes. When a storage node is down, vminsert re-routes new samples to the healthy nodes and vmselect marks responses as partial, unless it has been told the replication factor and enough copies remain.
Object storage is for backups only, and queries never read from it. vmbackup works from an instant snapshot and uploads it to S3, GCS, Azure Blob or anything S3-compatible, incrementally when the destination already holds an earlier backup, and vmrestore reads it back.
Downsampling (-downsampling.period=30d:10m keeps one sample per ten minutes for data older than 30 days) and retention filters (-retentionFilter, a different retention for a set of series or a tenant) are Enterprise features. In the open-source version, retention is one number for the whole database.
The trade against Thanos and Mimir
Thanos and Mimir keep long-term blocks in object storage. Capacity is whatever the bucket grows to, and the price is the machinery in front of the bucket: store gateways to read blocks back, a compactor, usually caches. VictoriaMetrics keeps everything on block storage it reads directly. There is less to run, and capacity becomes your job: you size the volumes and decide when to add a node that old data will not move to.
The VictoriaMetrics FAQ argues its side with claims about how much recent data the other systems can lose when a component fails. Those are a vendor’s claims about its competitors and I have not tested them.
VictoriaLogs: is it like Loki?
It does the same job with the opposite indexing decision. VictoriaLogs was announced on 22 June 2023, reached v1.0.0 on 12 November 2024, and was at v1.53.0 when I wrote this. It now lives in its own repository under Apache 2.0.
Loki, in its own words, “does not index the contents of the logs, but only indexes metadata about your logs as a set of labels for each log stream”. Lines are “compressed and stored in chunks in an object store”, and searching for text means reading the chunks the labels selected. I went through what that does to label design in the post on collectors and labels.
VictoriaLogs stores each field of a log entry as its own column and keeps a bloom filter per column in every block. The company’s post on the on-disk layout describes a search like this: “when you search for error, VictoriaLogs asks each block’s bloom filter first, skips every block that answers ‘definitely not’, and only then reads the actual values from the few blocks that answered ‘maybe’.”
That makes high-cardinality fields ordinary fields. The docs say it supports fields “such as trace_id, user_id and ip”. In Loki those have to stay out of labels, and Loki’s answer is structured metadata.
Stream fields still exist. A log stream is identified by a few fields that name the application instance, and the key concepts page is as firm as Loki’s docs that trace_id, user_id and ip do not belong there. The cardinality rule did not go away. It applies to fewer fields.
The biggest practical difference from Loki is where the data sits. Logs go to local disk in per-day partitions, directories named YYYYMMDD under -storageDataPath, and retention (seven days by default) removes whole days. There is no object storage backend, which is the same trade as on the metrics side.
Queries are written in LogsQL:
_time:5m error
_time:5m {app="nginx"} error
_time:5m error | stats count() errors
The first matches every entry from the last five minutes whose message contains the word error. The second narrows that to one stream, and the third counts.
You do not need a new collector to try it. VictoriaLogs accepts Loki’s push API, the Elasticsearch bulk API, OpenTelemetry, syslog and journald, and its docs list Fluent Bit, Vector, Alloy and the OpenTelemetry Collector among the shippers.
It runs as one binary. In cluster mode the same binary acts as vlinsert, vlselect or vlstorage, depending on whether -storageNode is set. One thing the cluster does not do: “vlinsert doesn’t replicate incoming logs among vlstorage nodes”. It shards them. The documented route to HA is two independent clusters with the shipper writing to both. Tenancy is an (AccountID, ProjectID) pair, as on the metrics side, carried in request headers.
The project’s headline numbers are “up to 30x less RAM and up to 15x less disk space than other solutions such as Elasticsearch and Grafana Loki”, and its FAQ claims typical full-text queries run “up to 1000x faster than Grafana Loki”. What I would test is narrower: one of my own Loki queries that greps a big namespace for a string that is not a label.
VictoriaTraces: spans stored as log rows
VictoriaTraces is the newest of the three and the least finished. Its first release, v0.1.0, is dated 28 July 2025. The latest at the time of writing is v0.12.0, from 29 September 2026, and the README still says “This project is currently a work in progress”, with a warning that on-disk data structures and API endpoints may change incompatibly.
The docs give the design in two sentences: it “was initially built on top of VictoriaLogs”, and it “receives trace spans in OTLP format, transforms them into structured logs”. Each span becomes a row:
service.nameand the span name become the stream fields.- Resource, scope and span attributes become ordinary fields, with a prefix for each kind.
- A
durationfield is computed at ingestion, because the OTLP request does not carry one.
Because the row lands in the VictoriaLogs engine, every attribute is searchable the way a log field is, and spans get per-day partitions and a seven-day default retention. Fetching one trace by its ID is the query a log store is not shaped for, so VictoriaTraces also keeps a separate index stream. A lookup by trace ID reads the trace’s start time from that index first, which tells it which partitions to scan.
What it accepts and serves today:
- In: OTLP only, over HTTP (
/insert/opentelemetry/v1/traces) and gRPC. The ingestion docs list no Jaeger or Zipkin receivers. - Out: the Jaeger Query Service JSON API. Grafana’s Jaeger datasource and the Jaeger UI both work against
/select/jaeger. LogsQL works too, since spans are rows. - Out, marked experimental: the Tempo HTTP API, which is what gives you TraceQL. Grafana’s Tempo datasource needs v0.9.4 or later, and the docs warn that some panels and TraceQL features may not behave as they do on Tempo itself.
So calling it a drop-in replacement for Tempo is ahead of the facts. A backend for the Jaeger API, with Tempo compatibility in progress, is accurate.
The cluster has three roles with familiar names: vtinsert, vtselect and vtstorage, with spans distributed by trace ID. Like VictoriaLogs, it has no built-in replication. Tenants are AccountID and ProjectID request headers.
Tempo, Jaeger and OpenObserve
I first filed VictoriaTraces next to the tracing part of OpenObserve, which turned out to be the wrong shelf.
Tempo is the direct comparison. It is a trace database that stores Parquet blocks in object storage, accepts OTLP, Jaeger and Zipkin, and in microservices mode now puts a Kafka-compatible queue behind its distributor. The VictoriaTraces docs claim “up to 3.7x less RAM and up to 2.6x less CPU” than Tempo.
Jaeger is not a database. It “requires a persistent storage backend”, such as Cassandra, Elasticsearch or OpenSearch. VictoriaTraces takes over the storage and the query API and leaves you the Jaeger UI.
OpenObserve is one platform for logs, metrics and traces, written in Rust, storing Parquet on object storage, with an AGPL-3.0 open-source edition. The fair comparison for it is the three Victoria databases together, or Grafana’s Loki, Mimir and Tempo together.
Everything else the project ships
The three databases are the core. Around them, as of October 2026:
A Kubernetes operator. The VictoriaMetrics operator manages custom resources for all of it: VMSingle, VMCluster, VMAgent, VMAlert and VMAuth for metrics, VLSingle, VLCluster, VTSingle and VTCluster for logs and traces. The part that matters for a migration is that, by default, it converts existing Prometheus Operator objects: a ServiceMonitor becomes a VMServiceScrape, a PodMonitor a VMPodScrape, a PrometheusRule a VMRule. Charts that ship a ServiceMonitor keep working.
Helm charts. One repository (https://victoriametrics.github.io/helm-charts/, also published as OCI) holds charts for every component. victoria-metrics-k8s-stack is the counterpart of kube-prometheus-stack: the operator, a VMSingle or VMCluster, VMAgent, VMAlert, Alertmanager, Grafana, node-exporter and kube-state-metrics, with dashboards and recording rules taken from the kube-prometheus project.
An agent for logs. vlagent discovers and collects pod logs on Kubernetes, buffers on disk when VictoriaLogs is unreachable, and can replicate to several VictoriaLogs instances.
Grafana datasources. For metrics, Grafana’s built-in Prometheus datasource works, and a separate VictoriaMetrics datasource plugin adds MetricsQL. VictoriaLogs has its own datasource in the Grafana plugin catalogue. Traces go through Grafana’s Jaeger or Tempo datasource.
A managed service. VictoriaMetrics Cloud hosts VictoriaMetrics and VictoriaLogs deployments, with VictoriaTraces deployments marked as beta.
Anomaly detection. vmanomaly turns your metrics into an “anomaly score” series that you alert on. It is part of the Enterprise offering and needs a licence key.
What is open and what is Enterprise
VictoriaMetrics, VictoriaLogs and VictoriaTraces are Apache 2.0, and that covers the cluster versions as well as single-node.
The Enterprise page lists what is held back, including downsampling, multiple retentions, automatic discovery of vmstorage nodes, vmbackupmanager for scheduled backups, vmgateway for advanced auth and rate limiting, mTLS between components, Kafka and Google PubSub integration, multi-tenant rules in vmalert, IP filtering in vmauth, FIPS builds, vmanomaly, and long-term-support release lines. Enterprise binaries need a licence key, and a trial key is available for evaluation.
Of that list, the two that change an architecture decision are downsampling and per-tenant retention. A cluster shared by many tenants adds a third: the per-tenant rate limits in vmgateway.
Adopting it, and when it fits
There are two ways in, and the first is small.
Keep Prometheus and add a remote write. Run a single-node VictoriaMetrics and put this in the Prometheus config:
remote_write:
  - url: http://victoriametrics:8428/api/v1/write
Prometheus keeps scraping, alerting and serving its 15 days. VictoriaMetrics becomes the long-term store and, once several Prometheus servers write to it, the global view: one Grafana datasource over all of them. Nothing you run today has to change. remote_write only forwards samples from the moment it is switched on, so history already sitting in Prometheus’s TSDB is a separate import: vmctl has a prometheus mode that reads a Prometheus snapshot and imports the samples from its blocks into VictoriaMetrics. With an HA pair, set the deduplication flag and remove the replica label, as in the section on the pieces.
The second way is to replace Prometheus. vmagent scrapes, VictoriaMetrics stores, vmalert evaluates rules, and Alertmanager stays where it is. On Kubernetes that is the victoria-metrics-k8s-stack chart, with the operator translating your existing ServiceMonitors. The argument for going this far is that a scraper with no TSDB is a smaller thing to run in every cluster than a full Prometheus. That argument does not apply if you already run Prometheus in agent mode.
Then there is the case the design fits best: many clusters and one backend. A vmagent runs in every cluster, they all push to one central multi-tenant VictoriaMetrics cluster, and each customer or environment is a tenant.
vmagent (cluster A) \
vmagent (cluster B)  -> vmauth -> vminsert -> vmstorage (N nodes)
vmagent (cluster C) /                              ^
                                                   |
                         Grafana -> vmauth -> vmselect
Each agent authenticates to vmauth, which maps its credentials to a tenant path, so no cluster can write into another’s tenant. Agents buffer locally through a backend outage, and one Grafana sits over everything. Tenants are numbers, so the mapping from customer to ID has to live somewhere. Tenants also share the cluster’s capacity. Open-source vmauth can cap concurrent requests per user with max_concurrent_requests; per-tenant rate limits are in vmgateway, which is Enterprise, as is a different retention per tenant.
When something else is the better choice
Stay on plain Prometheus if you have one cluster, two weeks of history is enough, and an HA pair with Alertmanager deduplication covers your alerting.
Choose Thanos or Mimir if you want long-term data in object storage and would sooner run more components than manage disk capacity, or if you already operate one of them and it works. If you need downsampling without a licence, that narrows to Thanos: its compactor does it in the open-source project, and Mimir’s migration guide lists Thanos’s downsampling as a feature it does not support.
The same reasoning carries to logs and traces. Loki and Tempo put the bulk of the data in a bucket; VictoriaLogs and VictoriaTraces put it on volumes you size. And VictoriaTraces has a version number that starts with zero.