
Two Grafana dashboards. Same node. Same timestamp. One shows 62 GB used out of 64 GB. The other shows 10 GB used. I was ready to file an incident. The node was perfectly fine.
Here’s what was actually happening - and why most people are watching the wrong memory metric.
The Two Graphs
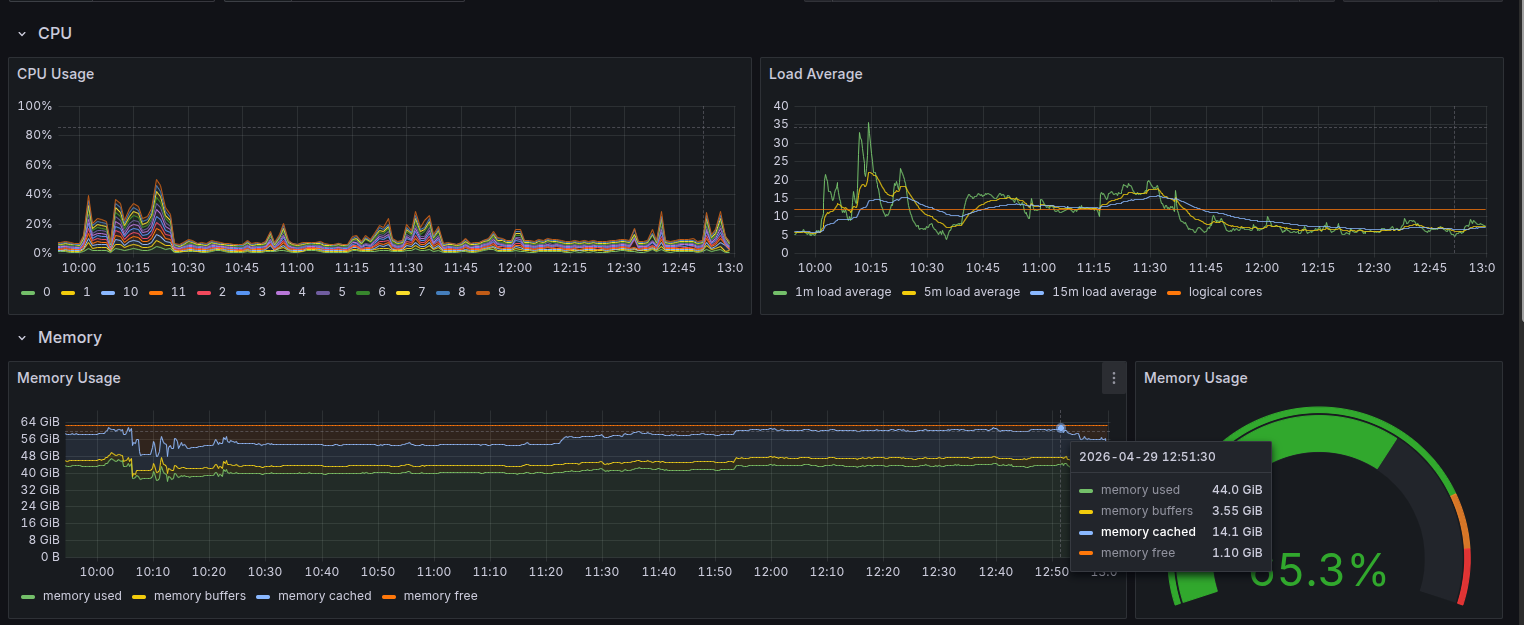
Graph 1 - Node Exporter: reads raw kernel stats, shows ~62 GB used
Graph 2 - Compute Resources (kube-state-metrics): shows ~10 GB used by workloads
The difference isn’t a bug. It isn’t a misconfiguration. It comes down to where each graph gets its data from - and what that data actually includes.
Why Graph 1 (Node Exporter) Shows 62 GB
Node Exporter takes a very short, very raw path to your screen:
- The Linux kernel maintains a file at
/proc/meminfothat tracks every memory stat on the system. - Node Exporter reads this file directly - no filtering, no interpretation.
- It exposes the raw numbers to Prometheus.
- Grafana computes
MemTotal - MemFreeand draws the graph.
That subtraction includes everything the kernel is holding - your apps, caches, buffers, kernel internals. All of it looks “used” here.
Why Graph 2 (kube-state-metrics) Shows 10 GB
This graph travels through many more layers, but each layer filters down to just real app memory:
- Your container runs a process which occupies actual RAM pages.
- cAdvisor, running on every node, reads each container’s RSS (Resident Set Size) - the RAM the process is literally sitting in right now - and exposes it to kubelet.
- kubelet reports this up to the Kubernetes API server.
- kube-state-metrics scrapes the API server and converts it into Prometheus metrics.
- Grafana queries those metrics and draws the graph.
By the time the number reaches your screen, it represents only what your workloads are actually consuming. Nothing else. That’s why it shows ~10 GB.
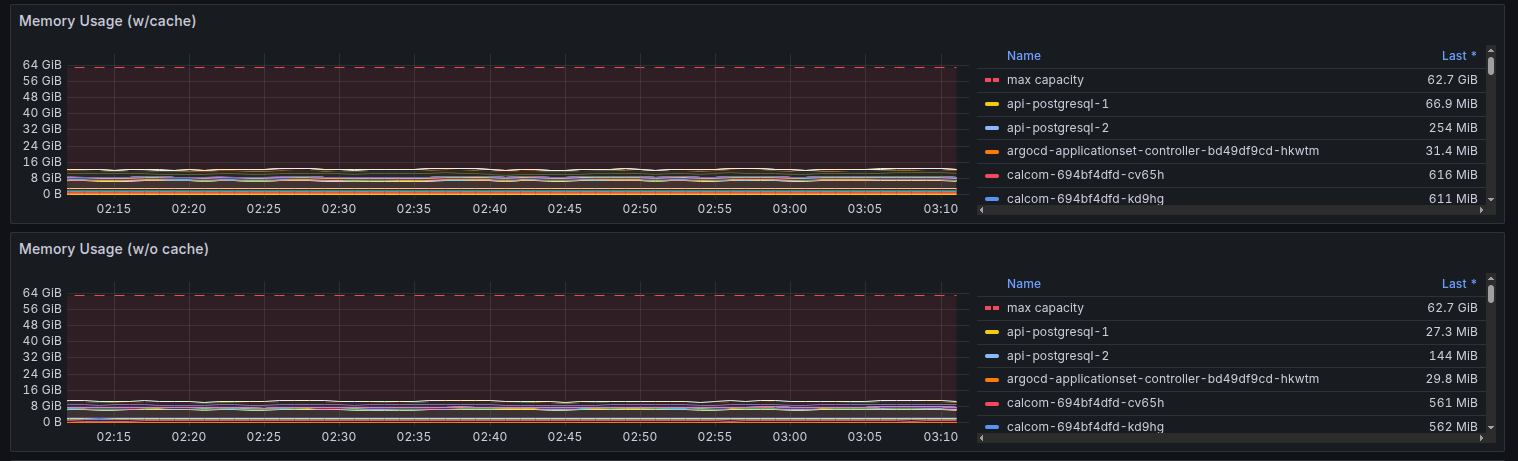
So What’s Hiding in the Other 52 GB?
Here’s the full breakdown of where memory was actually going on this node:
| What | Amount | Reclaimable? |
|---|---|---|
| App workloads (RSS) | ~10 GB | ❌ Real usage |
| ZFS ARC Cache | ~29 GB | ✅ Yes |
| Linux Page Cache | ~14 GB | ✅ Yes |
| Kernel Buffers | ~3 GB | ✅ Yes |
| Kernel Slab | ~5 GB | ✅ Mostly |
ZFS ARC Cache (~29 GB) - ZFS aggressively caches disk blocks in RAM so storage reads never hit the actual disk. It looks used, but Linux will evict it the moment a real application needs the memory.
Linux Page Cache (~14 GB) - Every file you read - logs, configs, binaries - Linux keeps a copy in RAM so the next read is instant. Same deal: fully reclaimable.
Kernel Buffers (~3 GB) - Not file contents, but filesystem structure. Where files live on disk, their permissions, their size. The index, not the books.
Kernel Slab (~5 GB) - Internal kernel data structures: network connections, process tables, directory entry caches.
Add it up: 10 + 29 + 14 + 3 + 5 = ~61 GB. That’s your “62 GB used” in Node Exporter.
Why Does Linux Do This?
Linux has one philosophy: idle RAM is wasted RAM.
Every spare byte gets put to work caching something - files, disk blocks, metadata. And the moment a real application needs that RAM, Linux silently evicts the cache and hands it over. No drama. No OOM killer. Just quiet background optimization.
A low MemFree on Linux is not a warning sign. It’s the kernel doing its job.
The Numbers That Actually Matter
There are three numbers worth watching. Most dashboards show you the wrong one by default.
MemFree - RAM nobody is touching at all. Linux intentionally keeps this low. Do not watch this.
MemAvailable - MemFree plus everything Linux is willing to evict on demand. This is your real headroom. This is the number that matters. On this node it was ~24 GB - plenty of room.
RSS via cAdvisor - What your actual workloads are consuming. This is what Graph 2 shows you.
The formula for actually free memory, if you want to calculate it manually:
Actually Free = MemFree + MemCached + Buffers
Or just read MemAvailable directly - the kernel already does this math for you.
The Rule
MemTotal - MemFree will always look scary on Linux. Ignore it.
MemAvailable approaching zero - that’s when you actually wake someone up.