Architecture
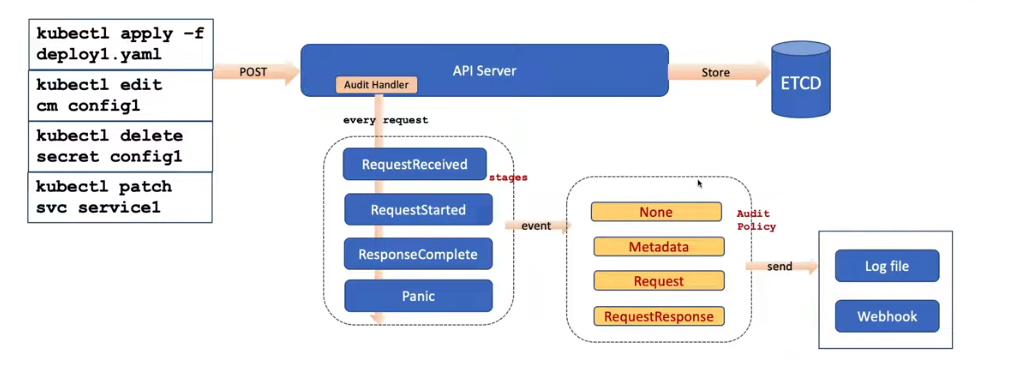
Every single request that hits kube-apiserver (eg. kubectl get pods) generates an audit event. There’s no separate “audit service” sitting beside the apiserver; auditing is a feature built directly into the apiserver’s request handling pipeline.
As that request moves through its lifecycle, it passes through up to four stages, and the apiserver can emit an audit event at each one.
The four stages
RequestReceived
Generated the moment the audit handler receives the request, before it’s been processed or authorized.
{
  "kind": "Event",
  "apiVersion": "audit.k8s.io/v1",
  "level": "Metadata",
  "stage": "RequestReceived",
  "requestURI": "/api/v1/namespaces/default/pods",
  "verb": "create",
  "user": { "username": "deploy-bot", "groups": ["system:serviceaccounts"] },
  "requestReceivedTimestamp": "2026-06-23T10:15:30.100000Z"
}
This stage exists, but not very usefull in most cases cause it roughly doubles event volume while telling you nothing you don’t already get.
ResponseStarted
Fired once the response headers go out, but before the response body is sent. This only applies to long-running requests - watch connections are the main case. A kubectl get pods -w or a controller’s informer watch will hit this stage, a normal kubectl get pods won’t.
{
  "kind": "Event",
  "apiVersion": "audit.k8s.io/v1",
  "level": "Metadata",
  "stage": "ResponseStarted",
  "requestURI": "/api/v1/namespaces/default/pods?watch=true",
  "verb": "watch",
  "user": { "username": "system:kube-controller-manager" }
}
ResponseComplete
The response body has been fully sent - nothing more is coming. This is the stage that matters most for almost every use case (security review, compliance evidence, “who deleted this?”, etc.), because it carries the complete picture: what was asked, who asked, and what the server actually did about it.
{
  "kind": "Event",
  "apiVersion": "audit.k8s.io/v1",
  "level": "Request",
  "auditID": "a1b2c3d4-e5f6-7890-abcd-ef0123456789",
  "stage": "ResponseComplete",
  "requestURI": "/api/v1/namespaces/production/pods/my-app-pod",
  "verb": "delete",
  "user": {
    "username": "shubham@company.com",
    "groups": ["developers", "system:authenticated"]
  },
  "sourceIPs": ["10.0.0.50"],
  "objectRef": {
    "resource": "pods",
    "namespace": "production",
    "name": "my-app-pod",
    "apiVersion": "v1"
  },
  "responseStatus": { "code": 200 },
  "requestReceivedTimestamp": "2026-06-23T10:15:30.123456Z",
  "stageTimestamp": "2026-06-23T10:15:30.234567Z"
}
Panic
Generated only when the apiserver hits an internal panic while handling the request. Rare, but useful as a signal of something seriously wrong in the request path - worth never filtering out, regardless of how aggressive your policy is elsewhere.
Audit levels - how much detail gets captured
None
Nothing is logged. The request is matched by a rule and dropped entirely - no event written at all.
- level: None
  users: ["system:kube-proxy"]
  verbs: ["watch"]
Metadata
Logs the request metadata - who, what verb, what resource, timestamp, source IP, response code - but never the request or response body.
{
  "kind": "Event",
  "level": "Metadata",
  "stage": "ResponseComplete",
  "verb": "get",
  "user": { "username": "jane.doe", "groups": ["developers"] },
  "objectRef": { "resource": "secrets", "namespace": "production", "name": "db-creds" },
  "responseStatus": { "code": 403, "reason": "Forbidden" }
}
For anything that touches secrets - Metadata is the only level you should use - otherwise it will show you the request body or the response body which has the base64 encoded secret which anyone can easily decode. Metadata doesnt show those details.
Request
Metadata plus the full request body. No response body.
{
  "kind": "Event",
  "level": "Request",
  "stage": "ResponseComplete",
  "verb": "create",
  "user": { "username": "ci-bot" },
  "objectRef": { "resource": "configmaps", "namespace": "kube-system", "name": "feature-flags" },
  "requestObject": {
    "kind": "ConfigMap",
    "apiVersion": "v1",
    "metadata": { "name": "feature-flags", "namespace": "kube-system" },
    "data": { "new-checkout-flow": "true" }
  }
}
You see what was sent, but not what the server returned.
RequestResponse
The most verbose - metadata, request body, and response body. Useful for high-value resources where you want to know exactly what changed and exactly what the server’s final state ended up being, but expensive in storage if we apply it broadly.
{
  "kind": "Event",
  "level": "RequestResponse",
  "stage": "ResponseComplete",
  "verb": "create",
  "user": { "username": "kubernetes-admin", "groups": ["system:masters"] },
  "objectRef": { "resource": "rolebindings", "namespace": "production", "name": "ci-deploy-binding" },
  "requestObject": {
    "kind": "RoleBinding",
    "roleRef": { "kind": "Role", "name": "deploy-role" },
    "subjects": [{ "kind": "ServiceAccount", "name": "ci-bot", "namespace": "production" }]
  },
  "responseObject": {
    "kind": "RoleBinding",
    "metadata": { "uid": "rb-uid-456", "resourceVersion": "9821" }
  }
}
This is the level you want for RBAC changes, NetworkPolicy changes, and anything where “what did it end up looking like after” matters as much as “what was requested.”
Writing an audit policy
A policy is just a list of rules evaluated top to bottom - the first matching rule decides the level for that request, and evaluation stops there. Order matters a lot here; a broad rule placed too early will swallow requests you meant to catch with a more specific rule below it.
apiVersion: audit.k8s.io/v1
kind: Policy
omitStages:
  - "RequestReceived"
rules:
  # Drop high-frequency system control plane identities
  - level: None
    users:
      - "system:kube-controller-manager"
      - "system:kube-scheduler"
      - "system:apiserver"
    verbs: ["get", "list", "watch"]

  # Drop kube-proxy watches
  - level: None
    users: ["system:kube-proxy"]
    verbs: ["watch"]

  # Always log node identity secret access - before the broad node drop rule
  - level: Metadata
    userGroups: ["system:nodes"]
    verbs: ["get", "list", "watch"]
    resources:
      - group: ""
        resources: ["secrets"]

  # Drop node group reads (scoped to reads only - mutations still fall through)
  - level: None
    userGroups: ["system:nodes"]
    verbs: ["get", "list", "watch"]

  # Always log secret reads at Metadata, before the kube-system drop below.
  # Otherwise a kube-system service account reading Secrets - a common
  # lateral-movement / privilege-escalation path - would go unaudited.
  - level: Metadata
    verbs: ["get", "list", "watch"]
    resources:
      - group: ""
        resources: ["secrets"]

  # Drop kube-system SA read traffic (ArgoCD, cert-manager, Cilium etc.)
  - level: None
    userGroups: ["system:serviceaccounts:kube-system"]
    verbs: ["get", "list", "watch"]

  # Drop health/metrics endpoints
  - level: None
    nonResourceURLs:
      - "/healthz*"
      - "/readyz*"
      - "/metrics"

  # Never write secret bodies, no matter the verb
  - level: Metadata
    resources:
      - group: ""
        resources: ["secrets"]

  # Full detail for resources that matter most for security review
  - level: RequestResponse
    resources:
      - group: "rbac.authorization.k8s.io"
      - group: "networking.k8s.io"
        resources: ["networkpolicies"]
      - group: ""
        resources: ["pods/exec", "pods/attach", "pods/portforward"]

  # Request body for PV/PVC changes
  - level: Request
    resources:
      - group: ""
        resources: ["persistentvolumes", "persistentvolumeclaims"]

  # Request body for general mutations
  - level: Request
    verbs: ["create", "update", "patch", "delete", "deletecollection"]

  # Catch-all
  - level: Metadata
A rule can filter on any combination of users, userGroups, verbs, resources (with group / resources / resourceNames), namespaces, and nonResourceURLs. The catch all thing at the end is for any other event that doesnt fall into the above criterias.
How to tune this in practice
There isn’t one universal policy - what gets logged, and at what level, depends heavily on the cluster’s role.
It depends on environment (prod vs. dev/staging):
- Production clusters generally run
RequestResponseon RBAC, NetworkPolicy, and exec/attach - these are the things you need full forensic detail on if something goes wrong. - Dev and staging clusters usually drop to
Metadata-only almost everywhere, or even disable auditing for low-value namespaces, since the security stakes are lower and the volume isn’t worth the storage cost.
It depends on compliance requirements:
- If you’re working toward ISO 27001, SOC 2, or NIS2 (relevant to anything classified as an Important/Essential Entity), auditors generally want to see who changed access control and network policy objects, with enough detail to reconstruct the change - which pushes RBAC and NetworkPolicy rules toward
RequestResponseregardless of environment. - Without a compliance driver, most teams are comfortable with
Metadataas the default and only escalate specific resource types.
It depends on log volume and retention budget:
-
A high-traffic cluster with thousands of requests per second at
RequestResponselevel can generate enormous log volume fast. Teams with tighter storage or shipping budgets push more rules towardMetadataand reserveRequest/RequestResponsefor a less no. of resource types. -
This is also why
omitStages: ["RequestReceived"]is used by most of the SRE teams - it’s like a “50% volume cut with no loss of information” in most cases, sinceResponseCompletealready contains the request_received timestamp.
It depends on what’s already noisy in your cluster:
- Health checks (
system:kube-probe), kube-proxy watches, kubelet node status updates, and reconciler loops (ArgoCD, controller-manager, your GitOps tooling) account for a large fraction of total apiserver traffic. Filtering these toNoneearly in the rule list is a good practice - without it, signals will get buried in noise.
So the shape you want, in order:
Nonefor known system/health noise, placed first - control-plane identities, kube-proxy watches, node reads, kube-system reconcile traffic, health/metrics URLsMetadatacarve-outs forsecretsinterleaved above each of those drops, so noise filtering never blinds you to secret accessMetadata- only, forced, forsecretson every remaining verb - this is what keeps bodies out of the logRequestResponsefor RBAC objects, netpols, andpods/exec/pods/attach/pods/portforwardRequestfor general mutating verbs (create/update/patch/delete/deletecollection) on everything elseMetadatacatch all at the bottom
Enabling it: editing the kube-apiserver static pod manifest
kube-apiserver is not a normal Deployment you can kubectl edit. It’s a static pod - the kubelet on each control-plane node watches a directory on disk (/etc/kubernetes/manifests/) and runs whatever pod manifests it finds there, directly, without the API server or scheduler being involved. So to turn auditing on, you edit files on the node, and the kubelet reacts.
Step 1 - put the policy file on the node
Write your policy to each control-plane node:
sudo mkdir -p /etc/kubernetes
sudo tee /etc/kubernetes/audit-policy.yaml > /dev/null <<'EOF'
apiVersion: audit.k8s.io/v1
kind: Policy
omitStages:
  - "RequestReceived"
rules:
  # ... your full policy from the section above, ordering intact ...
  - level: Metadata
EOF
sudo chmod 600 /etc/kubernetes/audit-policy.yaml
Step 2 - edit the static pod manifest
Open /etc/kubernetes/manifests/kube-apiserver.yaml on the node and make three additions.
a) The flags, added to the container’s command list:
    - --audit-policy-file=/etc/kubernetes/audit-policy.yaml
    - --audit-log-path=/var/log/kubernetes/audit/audit.log
    - --audit-log-maxage=30
    - --audit-log-maxbackup=10
    - --audit-log-maxsize=100
--audit-policy-file is the switch that turns auditing on; --audit-log-path is where events land, one JSON object per line. The three maxage/maxbackup/maxsize flags control log rotation (days retained / number of files kept / MB per file).
b) The volume mounts, added to the apiserver container’s volumeMounts - the apiserver runs in a container, so both the policy file and the log directory have to be mounted in from the host:
    - name: audit-policy
      mountPath: /etc/kubernetes/audit-policy.yaml
      readOnly: true
    - name: audit-log
      mountPath: /var/log/kubernetes/audit
      readOnly: false
c) The host volumes they refer to, added to the pod’s volumes:
  - name: audit-policy
    hostPath:
      path: /etc/kubernetes/audit-policy.yaml
      type: File
  - name: audit-log
    hostPath:
      path: /var/log/kubernetes/audit
      type: DirectoryOrCreate
The policy is mounted read-only (the apiserver only reads it); the log directory is read-write (the apiserver writes and rotates logs there). Note it’s the log directory that’s mounted, not just the file - with rotation on, the apiserver writes the active log plus rotated backups side by side, so the whole directory has to be host-backed for them to survive.
Step 3 - the kubelet restarts the apiserver for you
You don’t restart anything by hand. The moment you save the manifest, the kubelet notices the file changed and recreates the apiserver pod with the new spec. Expect a few seconds where the apiserver is unavailable while it comes back - on a multi-control-plane cluster, do one node at a time so the other apiservers keep serving.
A useful safety note: if you introduce a typo and the new apiserver manifest is invalid, the pod won’t come back up. Keep a copy of the working manifest before you edit, and on an HA control plane change one node at a time so a mistake never takes out the whole control plane at once.
Step 4 - verify
Once the pod is back:
# the flags actually made it into the running apiserver
sudo grep audit /etc/kubernetes/manifests/kube-apiserver.yaml

# events are landing
sudo tail -f /var/log/kubernetes/audit/audit.log
Then repeat the whole thing on every control-plane node. Each apiserver audits only its own traffic.
Ending notes and Links
If you take away one thing from this post, make it the ordering rule: audit policy is evaluated top to bottom, first match wins, and every mistake I’ve seen in the wild is really an ordering mistake - a broad None rule swallowing requests a more specific rule below it was supposed to catch. Write the noise drops first, interleave the secret carve-outs above them, and keep the catch-all at the bottom.
Two smaller things worth repeating:
- Audit logs on the node are only half the job.
maxage/maxbackup/maxsizerotation means events eventually get deleted, and a compromised node means compromised logs. Ship them off the node (Fluent Bit, Promtail, whatever you already run) if you actually care about them as evidence. - Test policy changes on a dev cluster first. An invalid policy file keeps the apiserver from coming up, and a wrong-but-valid one silently logs the wrong things, which you only discover the day you need the log.
Links:
- Auditing - official Kubernetes docs
- audit.k8s.io/v1 API reference for every field a rule can filter on
- kube-apiserver flag reference for the rest of the
--audit-*flags, including the webhook backend - The GKE/GCE reference audit policy - search for
audit-policy, it’s a good example of a battle-tested rule ordering
Thanks for your time.